


Dividends / Treasury Stock
 IR INFO
 Dividends / Treasury Stock
Dividends / Treasury Stock
Dividends / Treasury Stock

Dividends
(Unit: KRW Mill)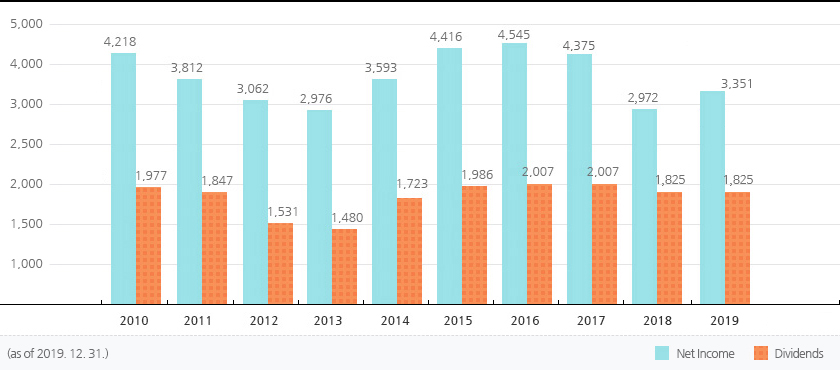
Dividends Details
| Classification | 2007 | 2008 | 2009 | 2010 | 2011 | 2012 | 2013 | 2014 | 2015 | 2016 | 2017 |
|---|---|---|---|---|---|---|---|---|---|---|---|
| Net Income (KRW Mill) | 292,777 | 309,270 | 390,000 | 421,785 | 381,175 | 306,229 | 297,596 | 359,349 | 441,629 | 454,534 | 437,541 |
| Total cash dividend (KRW Mill) | 133,237 | 148,489 | 192,684 | 197,686 | 184,734 | 153,068 | 147,999 | 172,328 | 198,684 | 200,712 | 200,712 |
| Dividend Payout Ratio (%) | 45.5 | 48.0 | 49.4 | 46.9 | 48.5 | 49.98 | 49.73 | 48.0 | 44.99 | 44.16 | 45.87 |
| Market dividend rate (%) | 2.5 | 5.1 | 5.5 | 3.2 | 3.24 | 2.5 | 2.33 | 2.65 | 2.4 | 2.7 | 2.8 |
| Cash dividendsper share history (won) | 630 | 720 | 940 | 970 | 910 | 755 | 730 | 850 | 980 | 990 | 990 |
- (fixed date : 2017. 12. 31)
Treasury Acquisition Status
(Unit : won,share)| Acquisition time | Treasury Acquisition Amount | Acquire shares | Treasury HOLDERS | Remarks |
|---|---|---|---|---|
| 2003. 03 | 9,291,282,000 | 850,000 | 850,000 | |
| 2004. 04 | 103,323,225 | 7,302 | 857,302 | Purchase Stock Dividend |
| 2004. 08 | -1,369,025,187 |  124,930 124,930 |
732,372 | Employee Stock Ownership free gift |
| 2005. 02 | 10,627,290,153 | 820,000 | 1,552,372 | |
| 2006. 02 | 12,431,692,260 | 700,000 | 2,252,372 | |
| 2007. 01 | 4,323,182,270 | 200,000 | 2,452,372 | |
| 2008. 03 | 25,075,597,000 | 1,219,840 | 3,672,212 | |
| 2008. 11 | 65,176,158,000 | 5,284,960 | 8,957,172 | |
| 2010. 02 | 20,047,318,500 | 1,183,840 | 10,141,012 | |
| 2011. 03 | 21,102,509,500 | 795,100 | 10,936,112 | |
| 2012. 01 | -2,388,619,800 | 156,600 |
10,779,512 | Employee Stock Ownership free gift |
| 2012. 03 | 19,000,000,000 | 421,990 | 11,201,502 |
- (fixed date : 2017. 12. 31)
COPYRIGHT ⓒ 2015 BY Kangwon Land, Inc. ALL RIGHTS RESERVED.
265 high1-gil, Jeongsun-kun, Gangwon State. Korea